What Are Stock Indices and How Do You Trade Them as CFDs?
Published on August 18, 2026
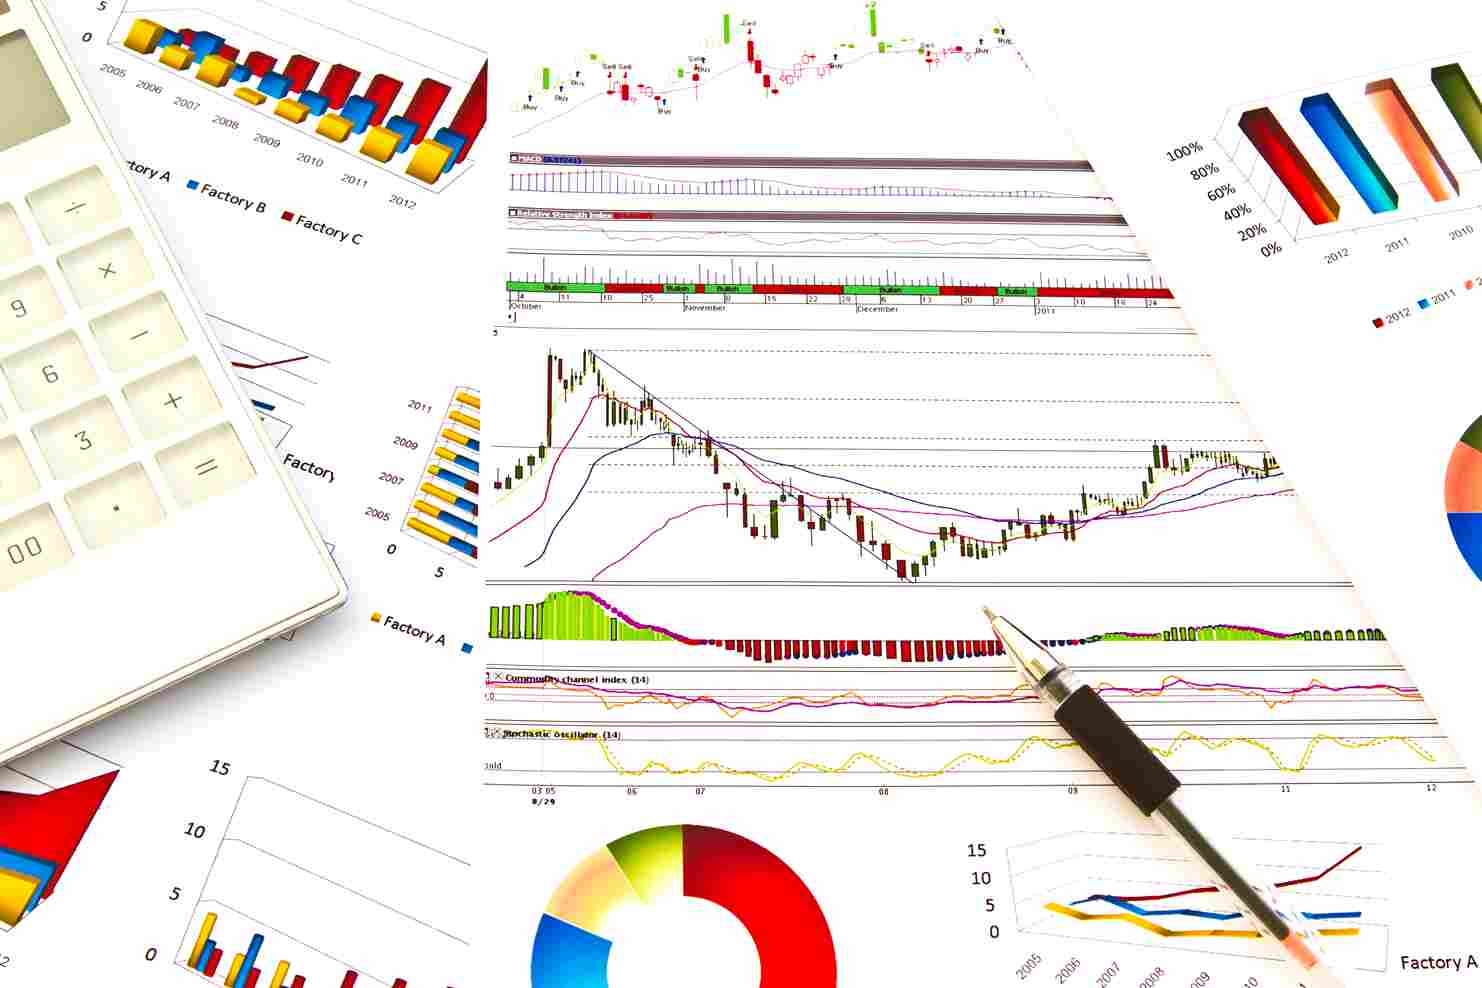 When someone says the S&P 500 hit a new high, or the Nasdaq is down 2% today, they are not talking about a single stock. They are talking about a stock index, a measurement of how a group of companies is performing all at once. The global stock market indices sector is projected to reach $127 trillion in 2026 according to Elliott Wave Forecast research, making indices some of the most liquid and actively traded financial instruments in the world.
For retail traders, indices offer something individual stocks cannot: a single position that reflects the health of an entire economy, sector, or region. Trading the S&P 500 gives you exposure to 503 of the largest US companies simultaneously. Trading the DAX 40 captures the direction of the German industrial economy. Trading the Nasdaq 100 concentrates you into US technology and growth. One order, hundreds of companies, one clean directional view.
This guide explains what stock indices actually are, why CFDs are the most common way retail traders access them, the six major global indices worth understanding, and exactly what to check before placing your first index trade.
$127T Projected global stock indices market size in 2026 — Elliott Wave Forecast
503 Number of companies actually in the S&P 500 as of 2026 (five have dual share classes)
24hr Approximate CFD trading window per day for major global indices
What Is a Stock Index?
A stock index is a method of measuring the performance of a specific group of stocks. Think of it as a basket. The S&P 500 basket holds 500 of the largest US companies. The FTSE 100 basket holds the 100 largest UK companies by market capitalization. The DAX 40 basket holds the 40 largest German companies. Each index has its own rules for which companies qualify and how much weight each one carries.
The single number you see quoted, for example the S&P 500 at 6,300, is not a share price. It is a calculated value that reflects the combined price movement of every stock inside the index, weighted according to that index's methodology. When you see the index rise, it means the collective value of those companies has increased. When it falls, they have collectively declined. Individual companies inside the index can move in the opposite direction of the index itself, since a strong performer can be offset by a weak one in the same period.
Indices serve two major purposes. They are benchmarks that let investors judge how their own portfolio is performing against the broader market. And they are tradeable instruments in their own right, allowing traders to take positions on the direction of an entire market rather than picking individual winners.
"When you trade an index, you are not buying or selling a single company like Apple, Microsoft, or Nvidia. You are taking a view on the overall direction of an entire market segment. That is genuinely powerful, because it lets you express a macroeconomic thesis in a single trade rather than trying to pick which specific stock will benefit most." — Elliott Wave Forecast Editorial Team — The Best Indices to Trade in 2026, April 2026
How CFDs Actually Work With Indices?
A Contract for Difference, or CFD, is a derivative that mirrors the price movement of an underlying asset without you actually owning that asset. When you trade an index CFD, you are agreeing to exchange the difference in the index's price between when you open the position and when you close it. If the index rises after you buy, you profit. If it falls, you lose.
This is fundamentally different from buying an ETF that tracks the same index, and the difference matters.
You do not own the underlying stocks:
Index CFDs give you exposure to price movement only. There are no voting rights, no dividends paid directly, no ownership stake in the companies themselves. You are trading price direction, not accumulating equity.
You can go long or short with equal ease:
Traditional stock investors can only profit if prices rise. Index CFD traders can open a sell (short) position just as easily as a buy (long) position, allowing you to profit from declines and hedge existing exposure.
Leverage amplifies both gains and losses:
Index CFDs are traded on margin, meaning a small deposit controls a much larger position. This magnifies profits when the trade goes your way but also magnifies losses if it does not. Most retail traders significantly underestimate how quickly leverage can compound losses.
Trading windows are extended beyond cash market hours:
Major index CFDs are typically tradeable close to 24 hours per day during the trading week, letting you react to news outside of regular US, UK, or German market opening hours.
The Six Major Global Indices Every Trader Should Know
1. S&P 500 (US 500)
Tracks 500 of the largest US companies across all sectors. Highly liquid, heavily influenced by US earnings reports, inflation data, and Federal Reserve policy. This is the single most watched equity index in the world and the natural starting point for anyone learning to trade indices for the first time.
2. Nasdaq 100 (US Tech 100)
Concentrates on 101 of the largest non-financial companies listed on the Nasdaq exchange, with heavy exposure to technology, AI infrastructure, and growth-focused businesses. More volatile than the S&P 500, and reacts sharply to earnings from names like Nvidia, Microsoft, Apple, and Alphabet. In 2026 the Nasdaq 100 has been particularly sensitive to AI-related earnings surprises and rate expectations.
3. Dow Jones Industrial Average (Dow 30)
Tracks 30 of the largest US companies, price-weighted rather than market-cap-weighted, which means higher-priced stocks carry more influence on the index level. Less diversified than the S&P 500 but often used as a shorthand for US large-cap industrial and consumer health.
4. FTSE 100 (UK 100)
Represents the 100 largest companies on the London Stock Exchange, with significant exposure to commodities, banking, and multinational businesses. Because roughly three-quarters of FTSE 100 revenues come from outside the UK, the index is heavily influenced by the British pound, oil prices, and global economic conditions rather than purely by the UK economy.
5. DAX 40 (Germany 40)
Europe's most watched index, tracking 40 of the largest German companies. Highly sensitive to European Central Bank policy, industrial production data, and global trade dynamics. Traders active in both the S&P 500 and DAX often note that the DAX reacts more sharply to ECB decisions while the S&P responds more to Federal Reserve communication.
6. Nikkei 225 (Japan 225)
The primary benchmark for the Japanese stock market, covering 225 large-cap companies listed on the Tokyo Stock Exchange. Reacts to Bank of Japan policy shifts, yen exchange rate movements, and Asian regional trade dynamics. Provides useful exposure to a market that operates during different hours than US and European indices.
What Actually Moves Stock Indices?
Individual stocks move on company-specific news like earnings and product launches. Stock Indices move on much broader forces, which is why understanding what actually drives them matters more than tracking any single company inside them.
Central bank policy decisions:
Federal Reserve rate decisions move the S&P 500 and Nasdaq. ECB decisions move the DAX. Bank of England decisions move the FTSE 100. Bank of Japan policy moves the Nikkei. Rate decisions and forward guidance from central banks are the single biggest scheduled catalyst for index price movement.
Inflation and employment data:
CPI reports, non-farm payrolls in the US, and equivalent reports globally shift expectations about future central bank policy, which then feeds directly into index prices. A softer-than-expected inflation reading often triggers immediate index rallies as rate cut expectations rise.
Corporate earnings season:
Quarterly earnings reports from index-heavy companies can move the entire index. A single Nvidia earnings surprise regularly moves the Nasdaq 100 several percent in a single session, given the company's weight in the index.
Geopolitical events and risk sentiment:
War, trade disputes, and political instability affect indices asymmetrically depending on their composition. The FTSE 100's commodity exposure means oil price spikes support it, while the same event pressures the DAX because Germany imports its energy.
Currency movements:
A stronger US dollar generally pressures the S&P 500 by hurting exporters, while a weaker pound often helps the FTSE 100 because most of its constituents earn revenue abroad. Currency direction is a genuine driver of index performance that many beginners overlook.
How to Actually Size a Stock Index CFD Position
Index CFDs have different pip and point structures than forex, and using the wrong sizing method is one of the fastest ways new traders take much more risk than they realize. Here is how position sizing actually works for a typical S&P 500 CFD trade.
Index CFD Position Sizing Example — $5,000 Account, 1% Risk
Account: $5,000 | Maximum risk per trade: 1% = $50. Trade: Buy S&P 500 CFD at 6,300 | Stop loss at 6,270 (30-point stop).
Typical S&P 500 CFD contract specifications (varies by broker): 1 standard lot = $1 per index point movement. 1 mini lot = $0.10 per index point movement.
For $50 max loss on a 30-point stop: Required point value = $50 divided by 30 points = $1.67 per point. Position size = 1.67 standard lots, or 16.7 mini lots.
Verification: 1.67 lots x $1 per point x 30 point stop = $50 = 1% of $5,000.
A Practical Checklist Before Placing Your First Index CFD Trade
Confirm the contract specifications with your broker:
Point values, minimum lot sizes, spreads, and trading hours vary noticeably between brokers. Never assume the specifications are identical across platforms.
Check the economic calendar first:
Central bank decisions, CPI releases, and non-farm payrolls all reliably move indices. Never open an index position without knowing what scheduled data is due within the next 24 hours.
Use stop losses that reflect actual index volatility:
The S&P 500 routinely moves 30 to 60 points in a normal session. A 10-point stop is not risk management, it is a guaranteed stopout on normal noise. Use ATR-based sizing to align stops with current conditions.
Watch for overnight financing costs:
Holding an index CFD position overnight incurs a swap charge that compounds over time. For positions held longer than a few days, factor this cost into your expected returns.
Start with the S&P 500 before trading more volatile indices:
The S&P 500 is the most liquid and least volatile of the major indices. Learning to read its price action before graduating to the Nasdaq 100 or DAX 40 significantly reduces the cost of your learning curve.
RISK DISCLAIMER
CFDs are complex instruments and carry a high risk of losing money rapidly due to leverage. A significant proportion of retail investor accounts lose money when trading CFDs, including stock index CFDs. Index CFDs are leveraged products and losses can exceed initial deposits without appropriate stop-loss protection and negative balance controls. Contract specifications, spreads, and trading hours vary between brokers and should be confirmed directly with your broker before trading. The global market projections, index composition details, and other data cited in this article reflect publicly available information as of now and are provided for educational purposes only. Past index performance is not indicative of future results. This content is for educational purposes only and does not constitute financial or investment advice. Please seek independent financial advice before making any trading decisions.
Find Your
Trading Paradise
Start trading with clarity, confidence, and control.